

7 Best Employee Activity Viewer Apps: We Tested the Top Contenders
By Jacob Tyler
October 9, 2026 18 min readSeeing that an employee was “active” is not particularly useful if you still have to open four reports to understand what they were actually doing.
A useful employee activity viewer should, therefore, make current activity, apps and websites, screenshots, active and idle periods, and historical records easy to inspect from a manager-facing dashboard.
With these exact requirements in mind, we tested seven apps. Throughout the process, we looked at how quickly we could understand current activity, reconstruct previous activity, filter what we needed, and put the information into context.
All our findings are discussed in detail within this guide.
A Quick Round-up of the Top 7 Employee Activity Viewers
- TimeBee provides the strongest overall mix of current and historical activity context.
- Insightful works well for granular workforce analysis, but its activity insights depend heavily on accurate configuration.
- ActivTrak is good at recognizing team-level patterns, although it is less useful for reconstructing detailed individual work sessions.
- Teramind offers the deepest live-screen and session evidence, though that depth comes with greater complexity.
- CurrentWare pairs activity visibility with direct web and app controls, but its interface and reporting are more technical.
- Hubstaff includes screenshot-based session evidence, although activity visibility depends on active work sessions.
- WorkTime is the strongest privacy-conscious alternative, though the lack of screenshots limits visual context.
How We Chose the Best Viewers and Tested What Managers Could Actually See
We started with 11 platforms and narrowed the field to seven that gave managers a meaningful way to inspect employee computer activity.
Our test environment included eight employee profiles and two administrator profiles across Windows 11, macOS, and Linux.
For a fair comparison, we repeated the same browser research, document editing, spreadsheet work, application switching, video call, low-input reading, and idle scenarios across the platforms.
We also ran two repeatable retrieval exercises.
First, while one tester changed applications and websites, another tester watched the manager dashboard and recorded when that change became visible.
Second, several days later, we asked the manager to reconstruct what Employee A had been doing during a specific one-hour period without relying on prior knowledge of the test sequence.
This mattered because employee activity viewing has two separate jobs. The first is telling you what is happening now. The second is helping you understand what happened earlier.
We then scored each platform out of 10 using the following weighted criteria.
Real-Time Activity Visibility and Usability — 30%
Our highest-weighted criterion measured how quickly a manager could answer:
What is this employee doing right now?
We assessed current working status, active and idle states, current applications and websites, live-screen information where available, team-level visibility, individual employee views, dashboard refresh behavior, and the path from a team overview to the underlying activity.
More surveillance did not automatically mean a higher score.
A live screen, for example, provides far more information than a status indicator. However, if reaching that screen requires several poorly organized menus, or if a manager cannot quickly move among employees, the viewer becomes less useful operationally.
Therefore, we scored both visibility and usability.
Historical Activity Review — 25%
Current status answers only part of the management question.
In many cases, you need to investigate something that happened yesterday or several days earlier.
For every platform, we attempted to locate the same historical period and determine:
- Which apps or websites were in use;
- Whether the employee was active or idle;
- Whether screenshots or other visual context were available;
- How activity changed during the selected period;
- Whether we could narrow records by employee and date;
- How long it took to reach the information.
We gave higher scores to products that let us reconstruct the activity from one coherent timeline or a small number of connected views.
Activity Context — 20%
Computer activity is easy to misread when it lacks context.
Seeing “Chrome — 48 minutes” does not tell you whether the employee was researching a client problem, reading documentation, watching entertainment, or leaving a tab open in the background.
Likewise, a low keyboard and mouse score does not prove that somebody was not working.
We therefore looked at the information surrounding each activity record, including:
- Applications and websites;
- Page or window titles where available;
- Active and idle states;
- Screenshots;
- Live screens;
- Activity intensity;
- Productivity classifications;
- Historical sequences.
The important question was whether the data helped us understand what had actually happened.
Filtering and Reporting Depth — 15%
Once an organization has dozens of employees, an activity viewer becomes much less useful if managers must manually scan everything.
We tested employee, team, group, date, app, website, screenshot, activity state, and productivity category filters where supported.
We also repeated a second query:
Which employee used Slack most during the previous five workdays?
This showed whether the platform could turn its activity records into an answer without requiring extensive manual export work.
Privacy Controls — 10%
An activity viewer can expose highly sensitive information, particularly when screenshots, live screens, recordings, page titles, communications, or detailed behavioral histories are involved.
We therefore evaluated:
- Manager and administrator permissions;
- Team-level access restrictions;
- Employee access to their own activity;
- Screenshot controls;
- Monitoring exclusions;
- Visible versus hidden monitoring;
- Retention controls.
A higher score here meant better control over who can see what, when, and why.
After Testing the Best Employee Activity Monitoring Software, These Are Our Top 7 Picks
| App | Score | Best For | Pricing | Compatibility | Main Limitation |
| TimeBee | 9.3/10 | Best overall employee activity viewer | 14-day trial; custom paid pricing | Windows, macOS, Linux, web, Chrome, iOS, Android | No continuous session playback |
| Insightful | 8.8/10 | Granular real-time workforce analysis | Paid from $8/seat/month | Windows, macOS, Linux | Activity insights depend heavily on accurate configuration |
| ActivTrak | 8.6/10 | Team-level activity and productivity analysis | Free; paid from $10/worker/month | Windows, macOS, ChromeOS | Productivity insights provide less individual session context |
| CurrentWare | 8.3/10 | Activity viewing with web and app controls | BrowseReporter $12/user/month | Windows, macOS; feature parity varies | Reporting and administration require more technical effort |
| Teramind | 8.1/10 | Detailed live activity and session reconstruction | Paid from $14/user/month | Windows, macOS, Linux | Deep monitoring requires substantial configuration and privacy controls |
| Hubstaff | 7.9/10 | Screenshot-based activity review | Paid from $4.99/seat/month | Windows, macOS, Linux, ChromeOS, iOS, Android | Input levels can lead to misinterpreted productivity |
| WorkTime | 7.5/10 | Privacy-conscious activity viewing | Free; paid from $6.99/employee/month | Windows, macOS | No screenshots or screen recordings |
7 Best Employee Activity Tracking Software We Tested for Live and Historical Activity Visibility
1. TimeBee — Best Overall Employee Activity Viewer (9.3/10)
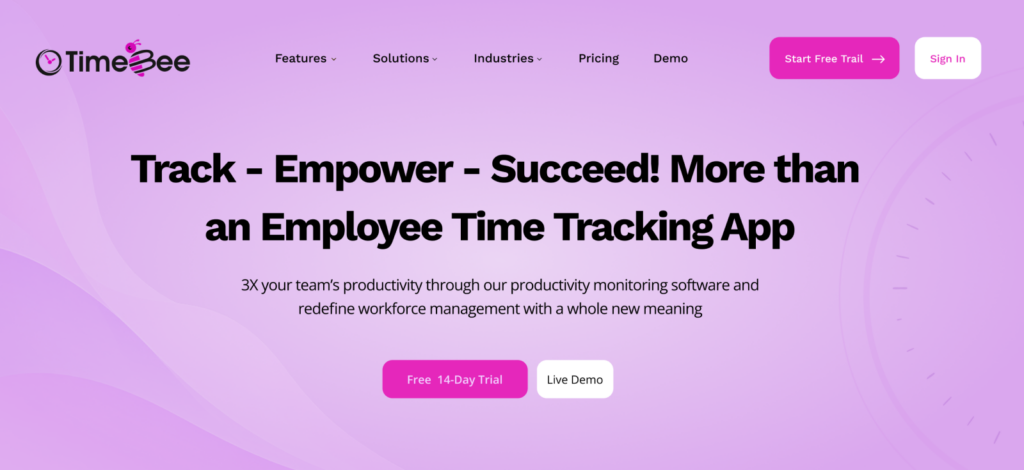
TimeBee ranked first because its manager-facing views gave us a useful combination of current employee status, historical activity, websites and applications, screenshots, activity intensity, productivity classifications, and work context.
The team dashboard gave us an aggregate starting point, while the user dashboard made it possible to move into a specific employee’s activity. The latter includes an activity timeline, website and application use, work breakdowns, date controls, and individual employee selection.
For immediate visibility, the “Live Preview” was particularly useful. Instead of opening a full historical report, we could check which employees were currently active and see the work context attached to that activity.
During 18 controlled application and website switches, changes appeared in the manager-facing views after approximately 12 seconds on average. Moreover, moving from the team view to the employee activity we wanted required three interactions in our test setup.
The historical experience was also stronger because TimeBee did not rely on one signal alone. Its website and application records retained duration and included more granular page- or window-level information. Screenshots then added visual context, with each image associated with the employee, timestamp, active app or website, and keyboard/mouse activity information.
When we looked at its settings, screenshot frequency was configurable, with options ranging from every two minutes to every 30 minutes, or fully disabled.
Filtering was another strength. We could narrow activity by user, group, date, and relevant work context instead of scanning one organization-wide activity stream. Role-based access also meant team leads and members did not automatically receive the same visibility as administrators.
TimeBee additionally connected with work platforms including project-management, development, productivity, and collaboration tools during our integration tests.
The main limitation is that TimeBee is not an always-on forensic viewer since it does not collect activity when the app is inactive, and there is no continuous video history to replay later.
TimeBee Pricing
- Free trial: 14 days;
- Paid plans: Custom pricing.
TimeBee Compatibility
TimeBee supports Windows, macOS, Linux, web access, a Chrome extension, iOS, Android, and kiosk-based deployments. The activity-viewing experience centers on desktop data and the web dashboard.
TimeBee Pros and Cons
| Pros | Cons |
| Current and historical employee activity can be reviewed from connected manager-facing views | Does not provide continuous session-video playback |
| Screenshots include useful app/site and activity context | Detailed setup takes longer than a basic activity viewer |
| Strong app and website detail, including more granular window/page context | Activity collection is not always-on when the desktop app is inactive |
| Useful employee, group, and date filtering | – |
Verdict
Choose TimeBee when you want one activity viewer that can move from who is currently active to what they were using, what appeared on-screen, and what their historical work pattern looked like. Overall, its strongest advantage is breadth of context.
See Employee Activity Without Stitching Together Separate Views
Learn More
2. Insightful — Best for Real-Time Workforce Analytics (8.8/10)
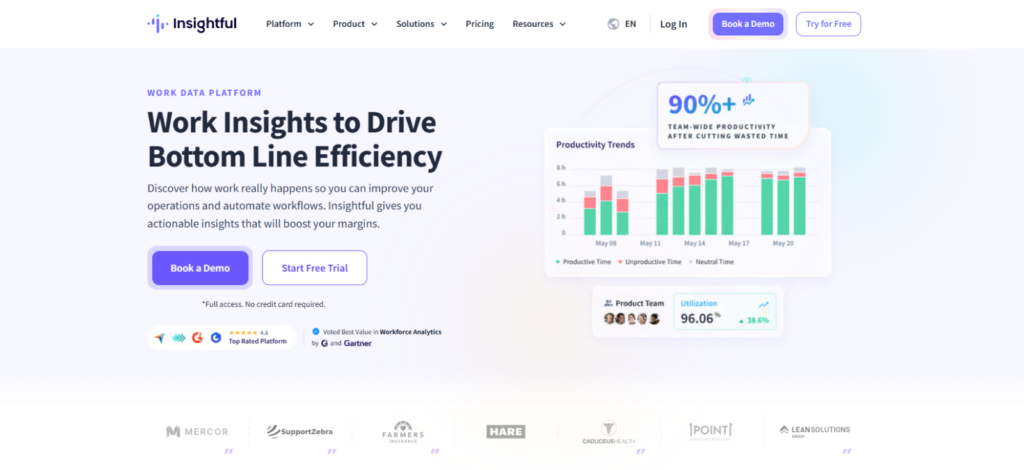
Insightful finished second because it gave us one of the fastest routes from a company-wide activity view to an individual employee’s underlying activity.
For testing, we used four of our employee profiles for a controlled 90-minute activity session. The testers switched between Chrome, Google Docs, Slack, Excel, and Zoom while we introduced three idle periods lasting 5, 10, and 15 minutes.
Across 20 application, website, and status changes, Insightful updated the relevant dashboard state in an average of 15 seconds. The fastest update appeared after 4 seconds, while the slowest took 25 seconds.
However, moving from the organization-level view to one employee’s detailed activity required four interactions: we had to narrow the workforce view, select the employee, open the relevant activity view, and then drill into the underlying record.
We then started testing whether the dashboard interpretation remained dependable.
During our low-input test, one employee spent 20 minutes typing, 20 minutes reading, 20 minutes reviewing a spreadsheet, and 20 minutes on a video call.
The typing period remained almost entirely active, but Insightful marked 6 minutes of reading, 8 minutes of spreadsheet review, and 11 minutes of the video call as idle periods.
That meant 25 of the 60 minutes of legitimate low-input work were represented less accurately than the typing-heavy activity.
We then deliberately changed Slack from productive to unproductive for one test team. That single configuration change reduced the team’s displayed productive activity by approximately 9 percentage points, even though nobody’s behavior had changed.
More importantly, correcting a classification did not always make the historical picture immediately clean. During our historical-review test, we found that previously generated views could continue reflecting older classifications until the relevant data refreshed.
Historical retrieval also exposed more friction than the live dashboard.
Three days after our original test, we asked a team member who had not performed the activity to reconstruct what Employee A had been doing between 2:00 p.m. and 3:00 p.m. The tester identified five of six planned activity changes in 3 minutes and 14 seconds.
The screenshots helped resolve the missing activity change, but reaching a complete answer required moving between the employee activity, app/website records, and screenshot evidence.
Insightful also lost points for reporting flexibility. We could filter by employee, team, project, task, and date, but some historical workflows were more constrained than we expected.
Certain reports had shorter lookback periods, while custom reports were less reusable because they could require rebuilding.
We also encountered two dashboard delays during our broader test window, where newly generated activity took materially longer than our normal 15-second average.
Insightful Pricing
- Workforce Analytics: $8/seat/month, billed annually;
- Workflow Optimization: $12/seat/month, billed annually;
- Combined plan: $16/seat/month, billed annually;
- Enterprise: Custom pricing.
Insightful Compatibility
Insightful supports Windows, macOS, and Linux.
Insightful Pros and Cons
| Pros | Cons |
| Provides detailed visibility across individual, team, and organization-level activity | Requires careful configuration to keep activity classifications meaningful |
| Combines live status, apps, websites, screenshots, and historical activity in one platform | Low-input work can be represented as idle or lower activity |
| Supports employee, team, project, task, and date filtering | Historical analysis can require moving between multiple activity views |
Verdict
Insightful works best when we need detailed employee-level activity together with a broader workforce view. However, its 8.8/10 score reflects the additional work needed to interpret that data correctly.
3. ActivTrak — Best for Activity and Productivity Dashboards (8.6/10)
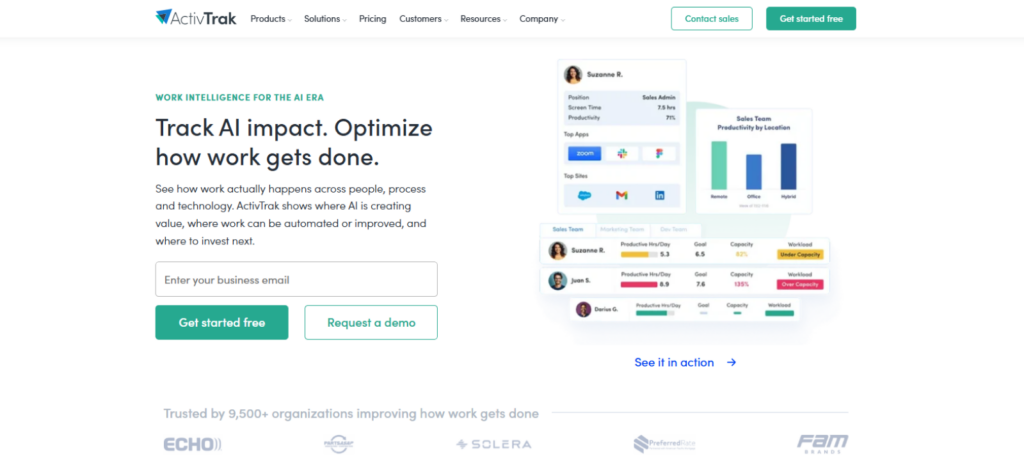
ActivTrak finished third as an employee activity tracking software because it was better at showing us where workforce activity patterns were changing.
For testing, we divided our eight employee profiles into three functional groups: content, operations, and development. Each group completed a different two-hour workflow, including browser research, document work, Slack conversations, spreadsheet analysis, video meetings, and development work.
We then configured the same applications differently by group. Slack was productive for operations, neutral for content, and unproductive for development, while Chrome received different classifications depending on the websites being accessed.
This was where ActivTrak worked particularly well.
After the classifications were set, we could compare the three groups without forcing the same productivity assumptions across completely different roles.
When we reviewed the previous five workdays, it took us 1 minute and 26 seconds to identify the group with the highest proportion of communication activity.
The aggregate dashboards therefore answered broader workforce questions quickly.
However, they also became highly dependent on the rules underneath them.
We changed Chrome from productive to unproductive and saw a 7-point movement in the content team’s productivity result.
That made the weakness clear: ActivTrak summarized configured activity very effectively, but the resulting productivity percentages could change substantially based on how administrators defined the same applications and websites.
We found another limitation when ActivTrak captured browser portions of a user’s activity but represented most of the offline planning period as inactivity.
In one test, an employee spent considerably more time in Chrome than the rest of their group over 90 minutes. ActivTrak surfaced the deviation clearly in the group-level data, but understanding the activity took longer.
We had to move from the dashboard into the employee activity history, inspect the website records, review page-level context where available, and then check screenshot evidence. It took 5 minutes and 36 seconds before our tester could explain the unusual browser period with reasonable confidence.
Moreover, while screenshots helped, they introduced another practical limitation.
We reviewed 32 screenshots across four employees during a historical investigation. The first batches loaded normally, but we encountered delayed thumbnail loading during five screenshot views, with the slowest usable image taking roughly 11 seconds to appear.
Overall, the platform made a gradual behavioral shift easier to see than individual employee records alone.
Although ActivTrak exposed substantial analytical depth, we did not find every dashboard equally intuitive without prior familiarity.
ActivTrak Pricing
- Free: $0, up to three workers;
- Work Activity Tracking: $10/worker/month, annually;
- Workforce Management: $15/worker/month, annually;
- Productivity Optimization: $17/worker/month, annually.
ActivTrak Compatibility
ActivTrak works on Windows, macOS, and ChromeOS.
ActivTrak Pros and Cons
| Pros | Cons |
| Makes team-level activity patterns and changes over time easy to identify | Productivity results depend heavily on application and website classifications |
| Supports different productivity rules for different groups and roles | Low-input and off-computer work can appear less active than keyboard-heavy work |
| Offers historical activity drill-down and screenshot context | Dense dashboards and advanced screenshot controls can add configuration and plan complexity |
Verdict
ActivTrak works best if you use it to answer pattern-based questions across teams. However, its weaknesses can become apparent when you try to turn those signals into conclusions about one employee.
4. CurrentWare — Best for Activity Viewing With Web and App Controls (8.3/10)
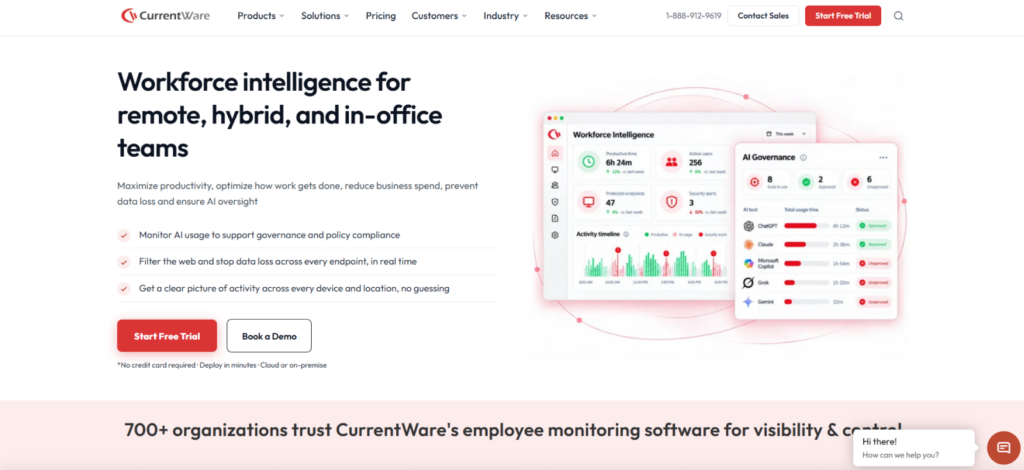
CurrentWare earned its 8.3/10 score because BrowseReporter gave us detailed visibility into employee website and application activity, while the wider CurrentWare suite let us act on the behavior we identified.
We started with six employee profiles and generated a mix of browsing, search, and application activity; BrowseReporter captured 45 of the 48 activity changes we expected.
When we returned to the dashboard the following day, we identified which employee had visited a selected domain most often. We narrowed the records to the relevant dates in 2 minutes and 11 seconds.
The detail became more useful once we moved beyond summary totals since we could inspect website visits, search queries, application usage, active and idle information, and user- or computer-level records.
We then tested the connection between viewing and control by adding BrowseControl to the same scenario. After identifying a repeated domain in BrowseReporter, we created a restriction for that site and attempted to access it five more times from the test device. All five attempts were blocked under the applied policy.
In our historical investigation, we asked a tester to find which applications one employee had used during 90 minutes three days earlier. The information was available, but the tester moved through six filtering and report-selection steps before reaching the final activity breakdown.
The process took 4 minutes and 23 seconds, largely because we had to choose the appropriate report, narrow the user and device, set the date range, and then interpret the resulting records.
We learned over time that the information was usually present, but finding the most useful view of it was the harder part.
We also found the screenshots useful as supporting evidence.
Its external connectivity was narrower than its internal module relationships. We could use the available API for downstream workflows, but activity data did not automatically flow into a wide range of external business applications without additional setup.
CurrentWare Pricing
- BrowseReporter: $12/user/month;
- BrowseControl: $6/user/month;
- Full CurrentWare Suite: $20/user/month.
CurrentWare Compatibility
CurrentWare supports Windows and macOS, but feature parity varies.
CurrentWare Pros and Cons
| Pros | Cons |
| Provides detailed website, application, browsing, and active/idle visibility | Requires more technical administration |
| Connects employee activity records with direct website and application controls | Detailed reports can require substantial filtering before they become easy to interpret |
| Supports user- and computer-level investigation | External integrations are more limited than its internal module ecosystem |
Verdict
CurrentWare is the strongest when the person reviewing activity also needs the authority to apply website or application controls. Its weakness, though, is the extra configuration, reporting, and administrative effort required to turn that data into a quick manager-facing answer.
5. Teramind — Best for Detailed Live Employee Activity (8.1/10)
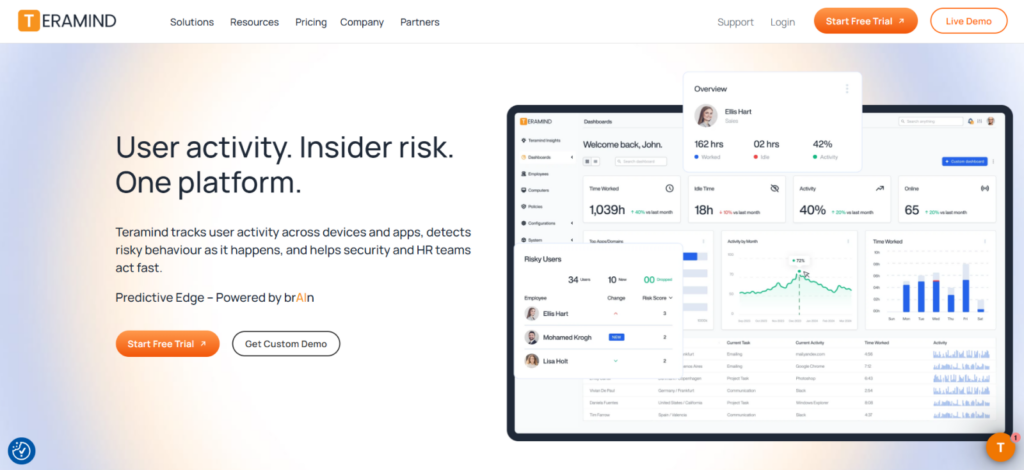
Teramind gave us the most detailed view of what happened inside an employee session, but that depth also created the greatest operational and privacy burden.
We began with five monitored employee profiles and enabled live screen viewing, session recording, application and website activity, screenshots, and behavior rules.
During a 25-minute controlled session, one tester moved through several predefined websites while completing a sequence of 10 known actions.
The live screen was the strongest part of the experience. Across 12 application and browser changes, the manager view reflected what was happening on the test device after an average of 3.8 seconds.
We then reviewed the same session after it ended.
A tester who had not watched the original activity correctly reconstructed nine of the 10 planned actions in 3 minutes and 42 seconds.
The timeline, recorded session, app and website activity, and behavioral events gave us enough context to investigate one specific incident from beginning to end.
However, the same test also showed how quickly the amount of evidence could become excessive.
A 25-minute session produced 17 separate events and alerts once we enabled application, website, file, and behavior monitoring together. And only six were relevant to the scenario we were investigating.
Behavior rules required similar tuning.
We created a rule to flag access to a predefined website category and then ran 15 controlled browsing attempts. The rule caught all six deliberately restricted visits, but it also generated three additional alerts from pages that matched the broader category.
After narrowing the rule conditions, the false alerts disappeared in our second run.
Recording continuity was a more serious concern because session evidence was central to why we were using Teramind.
Across 14 recorded test sessions, 12 were fully available when we returned to review them.
One recording contained a gap of approximately three minutes, while another endpoint temporarily stopped appearing until we checked the agent and re-established the monitoring state.
Administration also became progressively heavier as we enabled more monitoring.
Our initial live-screen setup was straightforward, but configuring recording behavior, access permissions, retention, alert rules, monitored content, and endpoint policies took about 41 minutes.
The privacy implications were equally visible during testing.
Teramind Pricing
- Starter: $14/seat/month, annually;
- UAM: $28/seat/month, annually;
- DLP: $32/seat/month, annually;
- Enterprise & Government: Custom pricing.
Teramind Compatibility
Teramind currently supports:
- Windows 10+ and Windows Server 2016+
- macOS Monterey 12.7.6+
- Ubuntu 24+, Debian 13+, and RHEL 9+ on supported Linux systems
Teramind Pros and Cons
| Pros | Cons |
| Provides live-screen viewing and detailed historical session playback | Session recording and endpoint reliability are critical dependencies |
| Makes specific digital events easier to reconstruct with surrounding context | Rules and alerts require careful tuning to avoid unnecessary noise |
| Supports granular behavior rules, event filtering, and investigation workflows | Recording, retention, permissions, and policy configuration require significant administration |
Verdict
Teramind is best suited to organizations that need detailed live visibility and the ability to reconstruct specific employee sessions after an event occurs. The trade-off is complexity since behavior rules require careful tuning and the volume and sensitivity of captured information demand strict permissions and retention policies.
6. Hubstaff — Best for Remote Team Activity and Screenshots (7.9/10)
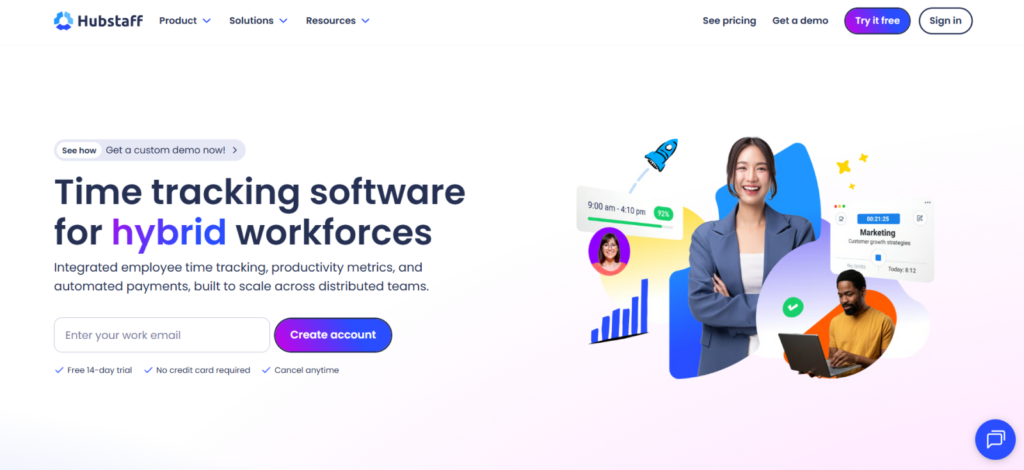
Hubstaff worked best when we treated it as a visual activity record tied to defined employee work sessions.
We could review screenshots, applications, URLs, and activity percentages, with views that narrowed by employee and date.
However, Hubstaff’s activity percentage required much more caution.
We tested 30 minutes of active typing, 30 minutes of browser research and reading, 30 minutes of document review, and 30 minutes in a video meeting.
The results looked like this:
- Typing: 79% activity;
- Browser research/reading: 46%;
- Document review: 34%;
- Video meeting: 18%.
Those numbers did not represent differences in whether useful work was happening. They primarily reflected differences in keyboard and mouse interaction.
Apps, URLs, and screenshots gave us better context than the percentage alone.
The integration ecosystem also added useful task context because Hubstaff supported connections to project and development systems, although our findings around Jira, ClickUp, GitLab, and some other integrations were inconsistent.
Hubstaff Pricing
- Starter: $4.99/seat/month annually;
- Grow: $7.50/seat/month annually;
- Team: $10/seat/month annually;
- Enterprise: $25/seat/month annually.
Hubstaff Compatibility
Hubstaff supports Windows, macOS, Linux, ChromeOS, iOS, Android, and browser-based workflows. Desktop environments provide the activity-viewing evidence most relevant to this comparison.
Hubstaff Pros and Cons
| Pros | Cons |
| Screenshots, apps, URLs, and activity levels provide useful session context | Activity evidence is dependent on active employee work sessions |
| Straightforward employee/date review | Keyboard and mouse activity can easily be mistaken for productivity |
| Screenshot controls can be adjusted or disabled | Screenshot monitoring can capture sensitive information |
Verdict
You should choose Hubstaff if screenshot evidence is central to how you review employee activity and your team already works in clearly defined digital sessions.
7. WorkTime — Best for Privacy-Conscious Activity Viewing (7.5/10)
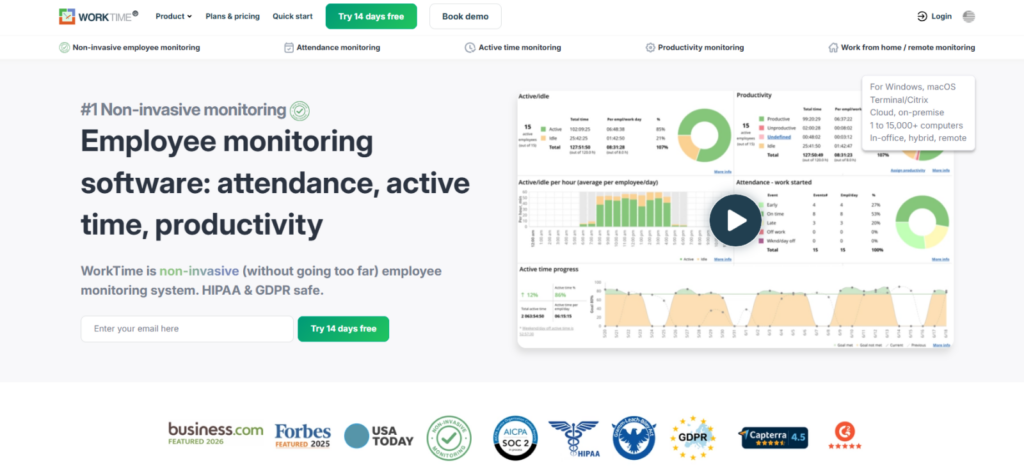
WorkTime gave us useful visibility into employee computer activity without storing screenshots, screen recordings, typed content, documents, chats, emails, passwords, or web-form data.
Instead, it relied on active and idle states, applications, websites, window information, and activity duration.
That approach worked well for straightforward computer activity. For example, in one sequence containing 18 application and website changes, WorkTime surfaced 15 correctly.
Historical records were also sufficient for broader reconstruction. Three days after one activity sequence, a reviewer correctly identified seven of nine known work changes in 4 minutes and 27 seconds using the available application, website, window, and activity records.
The privacy advantage was therefore meaningful: we could understand a substantial amount of employee activity without collecting the contents of the employee’s screen.
The limitations became clearer when the activity itself was ambiguous.
Across three 25-minute Chrome sessions involving client research, documentation reading, and general browsing, the available records allowed a reviewer to determine the exact activity in only one session confidently.
The remaining two could be narrowed to particular websites and browser activity, but there was not enough visual context to establish precisely what had happened.
In the end, we studied its reliability since it mattered more because there was no screenshot or recording to fall back on.
Across 16 monitored work sessions, 14 produced continuous histories. One contained an approximately six-minute gap, while another included a timestamp discrepancy that required us to check the surrounding activity before confidently reconstructing the sequence.
Reporting also became slower as the dataset grew. Across a seven-day activity history, identifying the employee with the highest usage of a selected application took 3 minutes and 9 seconds because we had to adjust several filters before reaching the final result.
WorkTime Pricing
- Free: $0, up to three employees with two weeks of data history;
- Basic: $6.99/employee/month;
- Premium: $8.99/employee/month;
- Enterprise: $10.99/employee/month;
WorkTime Compatibility
WorkTime supports Windows and macOS computers and offers both cloud and on-premises deployment.
WorkTime Pros and Cons
| Pros | Cons |
| Provides current and historical activity visibility without capturing screen content | Cannot visually verify ambiguous employee activity |
| Tracks applications, websites, active/idle states, and window information | Monitoring gaps and timestamp inconsistencies can weaken historical reconstruction |
| Reduces exposure of sensitive information displayed on employee screens | Detailed filtering and reporting can take longer to navigate |
Verdict
WorkTime is a reliable option for organizations that want structured employee activity visibility without collecting screenshots. However, its main weakness is the loss of visual certainty.
Which Employee Activity Viewer Is Best for Your Specific Business Use Case?
The best employee activity viewer apps for you depend on how closely you need to inspect activity and what you plan to do with the information afterward. Based on those differences, these are the strongest fits for each use case.
Best for Day-to-Day Employee Activity Visibility
- TimeBee: If you need one place to review current status, apps and websites, screenshots, and historical employee activity, TimeBee offers the most balanced everyday viewing setup.
- Hubstaff: If your review process depends mainly on screenshots, app/URL records, and activity levels during defined work sessions, Hubstaff is the more focused option.
Best for Workforce Activity Analysis at Scale
- Insightful: If you want to move from organization-wide activity into detailed records for a specific employee, Insightful provides stronger individual-level visibility and filtering.
- ActivTrak: If you need to compare teams, identify changing activity patterns, and analyze workload or software-use trends, ActivTrak is better suited to aggregate workforce analysis.
Best for Detailed Oversight and Policy Control
- Teramind: If you require live screens, recorded sessions, behavior events, and detailed historical reconstruction, Teramind provides the deepest session-level visibility.
- TimeBee: If you want detailed historical activity without continuous session recording, TimeBee combines screenshots, apps and websites, activity timelines, and employee-level filtering in a more conventional review workflow.
Final Verdict
TimeBee was our best overall employee activity viewer because it gave us the most balanced route from current employee status to historical activity and employee-level filtering.
However, that does not make it the deepest platform in every category.
Teramind gave us considerably stronger forensic visibility and continuous session evidence while ActivTrak made large-scale workforce patterns easier to interpret.
Insightful delivered more granular real-time workforce analysis, and CurrentWare was more suitable when monitoring needed to lead directly into endpoint-policy enforcement.
For that reason, our ranking rewards how useful the activity is once a manager actually has to view and interpret it.
FAQs
How to track employees’ daily activities?
You can track employees’ daily activities through project management platforms, task boards, shared calendars, and other work systems that show assignments and progress. However, for a more comprehensive view, use the best employee activity monitoring software that shows apps and websites, active and idle periods, screenshots, and historical activity.
Do employers have to tell employees that their activity is being viewed?
It depends on the jurisdiction, but transparency is generally the safer approach. In the U.S., there is no single federal rule requiring notice for every form of workplace monitoring, but state laws can impose specific requirements. For example, New York, Connecticut, and Delaware require notice for certain electronic monitoring activities. In the UK, employers generally must also inform workers about monitoring, subject to limited exceptions.
Can employee activity viewers see incognito or private browsing?
Incognito or private mode mainly prevents the browser from saving local history; it does not automatically hide activity from workplace activity viewer software. Therefore, a viewer that captures website or browser activity at the device level may still record those visits. TimeBee, for example, can collect incognito browsing activity when its monitoring is active.
How long should employee activity data be retained?
There is no single retention period suitable for every organization. Generally, keep activity data only as long as it serves the defined business, compliance, security, or investigation purpose for which it was collected.
How can managers avoid misinterpreting employee activity data?
Managers should interpret activity signals alongside their context. For example, low keyboard or mouse activity can reflect legitimate reading, planning, meetings, or document review. Apps, websites, page titles, screenshots, and historical patterns help explain what actually occurred before conclusions are drawn.
Are screenshots necessary for viewing employee activity?
No. Apps, websites, active and idle states, window information, and historical records can provide meaningful activity visibility without screenshots. However, screenshots become useful when those signals are ambiguous because they add visual context that numerical or categorical records cannot provide.
TimeBee: Build a Clearer Picture of How Work Gets Done
Explore TimeBee
Jacob Tyler
Member since July 2, 2026
Jacob Tyler
Member since July 2, 2026
Jacob Tyler is a B2B technology journalist specializing in workplace software, employee monitoring platforms, productivity technology, HR systems, data privacy, and the changing role of technology in modern organizations.
He holds an MSc in Information Systems from the University of Manchester. His professional qualifications include the CompTIA Data+ certification.
With more than 10 years of experience covering B2B software and digital transformation, Jacob focuses on translating complex product capabilities into clear guidance for business readers.
His work examines how software functions in practice, which operational problems it is designed to address, what data it collects, and what organizations should consider before implementation.
Through his writing, Jacob helps HR leaders, operations teams, founders, managers, and IT decision-makers understand workplace technology and make informed purchasing decisions.